How to Analyze Google Sheets Data With AI: 5 Easy Methods (2026)
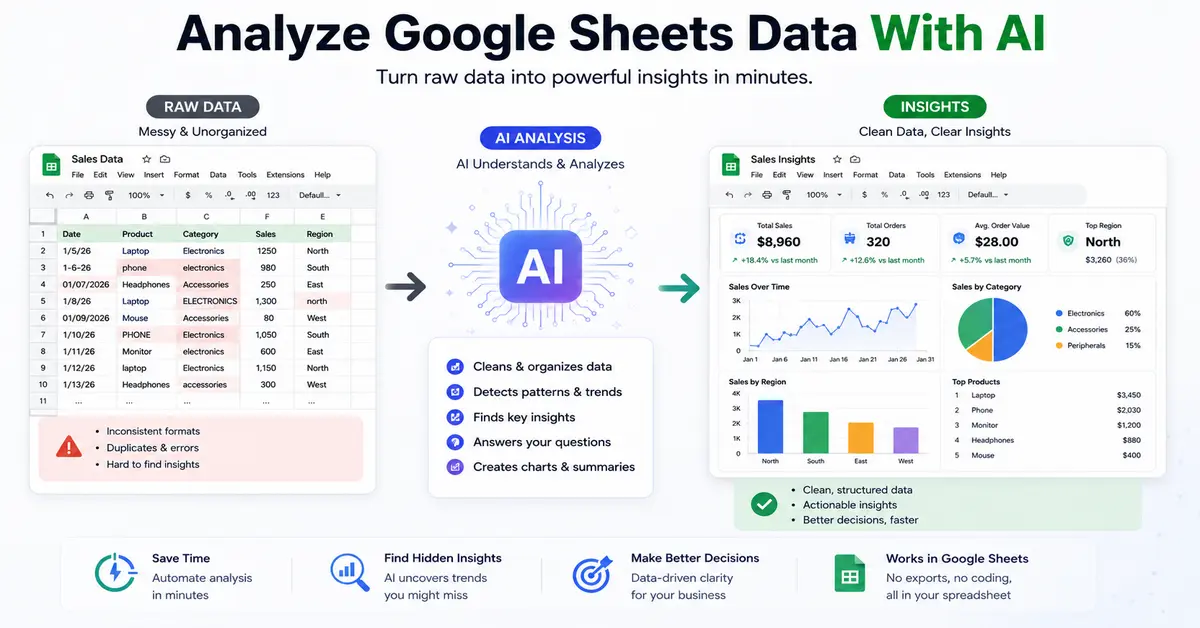
Yes, you can analyze Google Sheets data with AI without manually building every formula or pivot table. The easiest starting point is Gemini in Google Sheets, which can identify trends, summarize information, answer questions about your data, and create charts; for more advanced analysis, you can also use AI add-ons or external AI data-analysis tools.
The important part is knowing which method to use, what to ask AI, and how to verify the results before making a business decision from them.
What Can AI Actually Do With Google Sheets Data?
AI can help with much more than generating formulas.
Depending on the tool and your setup, you can ask AI to:
- Summarize a dataset
- Find trends
- Identify unusual values or outliers
- Compare categories
- Analyze sales performance
- Summarize customer feedback
- Categorize text
- Find patterns
- Create charts
- Explain what changed between periods
- Generate formulas
- Build tables
- Help create reports
Google’s current Gemini documentation specifically describes using AI in Sheets to analyze data, identify trends and key findings, create charts and graphs, and answer questions about spreadsheet data.
But there is an important limitation:
AI analysis is only as reliable as the data and context you give it.
If your spreadsheet contains missing values, inconsistent categories, incorrect dates, or duplicated records, AI can produce a confident-looking answer that is still wrong.
Read More: AI Formula Generator for Google Sheets
5 Ways to Analyze Google Sheets Data With AI
There isn’t one correct method for every spreadsheet.
The best approach depends on how much data you have, how sensitive it is, whether you need the analysis inside Sheets, and how complex your questions are.
Method 1: Use Gemini Directly in Google Sheets
For many Google Sheets users, this is the simplest place to start.
Google’s current Gemini features can analyze spreadsheet data and provide insights through natural-language prompts. Google documents prompts such as identifying trends, exploring month-to-month changes, and asking what analysis can be performed on a sheet.
How it works
- Open your Google Sheet.
- Make sure the data is organized with clear headers.
- Open Gemini in Sheets.
- Give it a specific question about your data.
- Review the analysis.
- Ask follow-up questions if necessary.
- Verify important results against the underlying data.
For example, suppose your sheet contains:
| Month | Sales | Orders | Marketing Spend |
|---|---|---|---|
| January | $42,000 | 520 | $8,000 |
| February | $47,500 | 570 | $9,200 |
| March | $44,200 | 490 | $10,100 |
| April | $56,800 | 640 | $11,000 |
Instead of manually calculating every change, you could ask:
“Identify the main sales trend from January through April and explain whether the increase in sales appears to coincide with changes in order volume and marketing spend.”
That’s a much better question than:
“Analyze this data.”
The first prompt tells AI what relationship you actually want to investigate.
What Gemini can help with
Google says Gemini in Sheets can help users identify trends and outliers, create charts, answer questions, and turn raw data into insights.
It can also work with AI functions such as =AI() for tasks including summarization, categorization and sentiment analysis, depending on feature availability and account eligibility.
Best for
Google Workspace users who want analysis without moving their spreadsheet into another application.
Method 2: Use the AI Function Inside Google Sheets
If your Google account has access to the current AI function, you can use AI directly from a cell.
Google documents the syntax as:
=AI("prompt", [optional range])
The range provides the information the AI should use when generating the result.
For example:
=AI("Summarize this customer feedback in one sentence", A2)
Or:
=AI("Classify this review as positive, neutral, or negative", A2)
This is especially useful when you have hundreds or thousands of text entries that need consistent processing.
Example: Customer feedback
Suppose column A contains:
“The product is easy to use but shipping took too long.”
You could ask AI to classify the sentiment.
Then the AI can populate another column with something such as:
Negative
You could repeat the process down the dataset.
Google also documents AI-powered table columns and the ability to fill ranges with Gemini-based actions.
Important limitation
The AI function does not automatically understand your entire Google Drive or every spreadsheet you own.
Google says the AI function works with the current spreadsheet context and recommends supplying the relevant range when you need the AI to use specific data.
So don’t assume:
“AI can see everything in my workbook.”
Give it the context it needs.
Best for
Repeated row-by-row tasks such as categorization, summarization and text analysis.
Method 3: Copy a Small Dataset Into an AI Chatbot
You don’t necessarily need a Google Sheets add-on.
For a small dataset, you can copy the relevant table into an AI chatbot and ask questions about it.
This is one of the simplest approaches for ad-hoc analysis.
A current Google Sheets/ChatGPT guide from Bricks describes this as a useful approach for small-to-medium datasets where you want quick analysis, summaries or trend identification.
Example
Suppose you have a marketing dataset:
| Campaign | Spend | Clicks | Leads | Customers |
|---|---|---|---|---|
| A | $2,000 | 4,500 | 180 | 32 |
| B | $3,500 | 5,200 | 250 | 48 |
| C | $1,800 | 3,100 | 140 | 41 |
Instead of asking:
“Analyze this.”
Try:
“Analyze these three campaigns. Calculate which campaign has the lowest cost per customer, identify the strongest conversion rate, and explain which campaign appears most efficient. Show the calculations before giving your recommendation.”
That’s a much better AI analysis prompt.
Why showing calculations matters
You don’t want an AI answer that simply says:
“Campaign C performed best.”
You want to know why.
For example:
Cost per customer = Spend ÷ Customers
Campaign C:
$1,800 ÷ 41 = approximately $43.90 per customer
That gives you something you can verify.
When this method works well
- Small datasets
- One-off questions
- Quick summaries
- Exploratory analysis
- Brainstorming
- Report preparation
When to avoid it
Don’t casually paste sensitive customer information, financial records or confidential business data into a public AI service.
The data-handling policies of the AI service you’re using matter.
Read More: Deduplicate Google Sheets With AI
Method 4: Connect Google Sheets to an AI Data-Analysis Tool
If your spreadsheet is large or your analysis is more complicated, a dedicated AI data-analysis platform may be more suitable.
The current market includes tools that connect directly to Google Sheets and can generate dashboards, reports, natural-language answers and recurring analyses.
For example, Anomaly AI describes a workflow where Google Sheets data is connected, analyzed with AI, turned into reports or dashboards, and refreshed as the source data changes.
Querri also positions its Google Sheets integration around analyzing data across sources, handling messy spreadsheets, and pushing formatted results back into Google Drive.
This type of tool makes more sense when your real requirement is:
“I need a repeatable reporting system.”
rather than:
“I have one spreadsheet question.”
Best for
- Recurring reports
- Large datasets
- Multiple data sources
- Dashboards
- Automated analysis
- Teams
Method 5: Use AI to Analyze the Spreadsheet, Then Build a Human-Checked Report
This is often the most useful approach for business users.
Don’t ask AI to replace your entire analytical process.
Use it for the parts where it is strongest:
AI finds patterns → human checks the evidence → final report explains the decision.
For example:
Step 1
Ask AI:
“Find the biggest month-over-month changes in revenue.”
Step 2
Ask:
“What could explain those changes based only on the columns available in this dataset?”
Step 3
Ask:
“Which findings have enough supporting data to be considered reliable?”
Step 4
Check the actual spreadsheet.
Step 5
Build the final report.
This reduces the risk of accepting an AI-generated interpretation without checking the underlying numbers.
What Should You Ask AI to Analyze?
A vague prompt produces a vague answer.
Instead of:
“Analyze my sales spreadsheet.”
Ask focused questions.
Sales
“Which products generated the most revenue during the last quarter?”
Trends
“Which metrics increased or decreased month over month?”
Outliers
“Identify unusually high or low sales values and explain which rows caused them.”
Customer analysis
“Which customer segments have the highest average order value?”
Marketing
“Compare campaign cost per acquisition and identify the most efficient campaign.”
Inventory
“Which products have declining sales but high inventory levels?”
Feedback
“Group these customer comments into the five most common themes.”
Forecasting
“Based on the historical monthly values, what patterns should I investigate before creating a forecast?”
Notice the wording.
The prompts ask AI to analyze specific questions, not simply “look at the spreadsheet.”
The Best Prompt Structure for Google Sheets AI Analysis
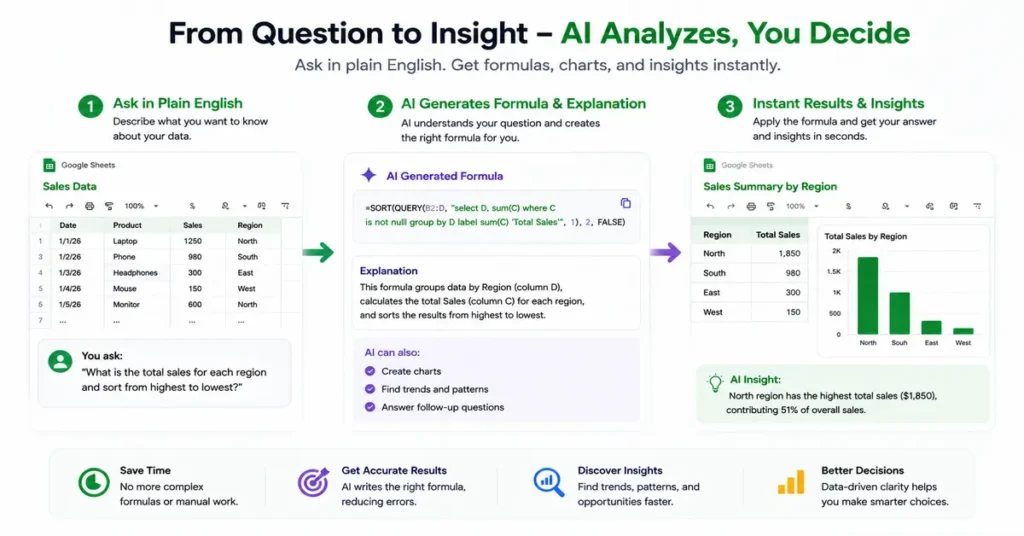
A useful prompt usually has five parts:
1. Role
Tell AI what perspective to use.
“Act as a marketing analyst.”
2. Dataset
Tell it what the columns represent.
“Column A is campaign name, B is spend, C is clicks, D is leads, and E is customers.”
3. Question
State exactly what you want to know.
“Identify the campaign with the lowest customer acquisition cost.”
4. Method
Tell it how you want the answer evaluated.
“Show the calculation and compare all campaigns.”
5. Output
Specify how you want the result.
“Return a short table followed by a three-sentence explanation.”
Full example
“Act as a marketing analyst. Column A contains campaign names, B contains ad spend, C contains clicks, D contains leads, and E contains customers. Calculate customer acquisition cost for each campaign, identify the most efficient campaign, show the calculations, and flag any campaign where the customer count appears unusually low relative to leads. Return the results in a table followed by a short explanation.”
That’s far more useful than:
“Analyze my marketing data.”
How to Prepare Google Sheets Before Using AI
This step is easy to ignore and causes many bad results.
Keep one clear header row
Use:
Date | Product | Revenue | Orders | Region
instead of:
Sales Report
January 2026
Revenue Data
...
Avoid mixed data types
Don’t put:
$5,000
5000
5k
N/A
in the same numerical column.
Keep dates consistent
Use actual date values rather than mixing:
Jan 5
5/1/26
January 5, 2026
without a consistent format.
Remove obvious duplicates
Duplicate records can distort totals and averages.
That’s why our previous article on deduplicating Google Sheets is directly relevant to this workflow.
Add meaningful column names
AI needs context.
Column D tells it almost nothing.
Customer Acquisition Cost tells it much more.
Can AI Find Trends in Google Sheets?
Yes.
Google specifically describes Gemini in Sheets as being able to identify trends, outliers and key findings from spreadsheet data.
But “find trends” should not mean:
“Tell me something interesting.”
That’s too open-ended.
Instead ask:
“Compare monthly revenue and order volume. Identify months where revenue changed by more than 15% and explain which available metrics changed at the same time.”
Now the AI has a measurable rule.
Can AI Create Charts From Google Sheets Data?
Yes.
Google says Gemini in Sheets can help build charts and graphs from spreadsheet data.
You can ask for:
- Bar charts
- Pie charts
- Trend charts
- Comparisons
- Visual summaries
But don’t assume the first chart is automatically the best chart.
For example:
Revenue over time → line chart
usually makes more sense than:
Revenue over time → pie chart
The AI can help create the visualization, but you still need to decide whether the visualization communicates the data correctly.
Can AI Analyze Large Google Sheets?
It depends on the tool, account, dataset structure and analysis you are asking for.
Google’s current Gemini documentation says Gemini in Sheets can work with large datasets, but its AI function also has generation limits and context limitations. For example, Google documents a limit of 350 selected AI-function cells generated at one time and explains that the AI function does not automatically have access to the entire spreadsheet or other Drive files.
So don’t assume:
“AI can analyze unlimited rows.”
For very large datasets, a dedicated data-analysis platform may be more appropriate.
Read More: AI Function in Google Sheets
AI Analysis Can Be Wrong Even When the Numbers Look Right
This is one of the most important things to understand.
Suppose your spreadsheet says:
| Month | Sales |
|---|---|
| January | $100,000 |
| February | $105,000 |
| March | $150,000 |
AI might correctly calculate that March increased sharply.
But it cannot automatically tell you why March increased unless the spreadsheet contains information that supports that explanation.
It may speculate:
“The increase was probably caused by stronger marketing.”
Unless your data actually contains marketing information that supports that conclusion, that’s a hypothesis—not a fact.
Separate:
What the data shows
from:
What might explain it
This is critical for trustworthy AI analysis.
How to Verify AI’s Analysis
Before acting on an AI-generated insight, check:
1. The source range
Did AI analyze the correct rows and columns?
2. The calculations
Can you reproduce the important numbers?
3. Missing data
Were blank values treated correctly?
4. Duplicates
Could duplicate rows have inflated the result?
5. Outliers
Is one unusual row driving the conclusion?
6. Time periods
Did AI compare equivalent periods?
7. Correlation vs causation
Did AI claim that one metric caused another when the spreadsheet only shows that they changed together?
That last mistake is particularly dangerous.
Gemini vs ChatGPT vs Dedicated Spreadsheet AI
The right choice depends on where your data lives.
| Your situation | Good starting point |
|---|---|
| Data already lives in Google Sheets | Gemini in Sheets |
| Small dataset and one-off analysis | General AI chatbot |
| Repeated in-sheet AI tasks | AI Sheets add-on |
| Large recurring reports | Dedicated AI analytics platform |
| Multiple data sources | AI analytics platform |
| Need dashboards and scheduled reports | Dedicated analytics tool |
Google’s native Gemini option has the advantage of working directly inside Sheets, while dedicated platforms can offer broader analysis, dashboards and recurring workflows.
Do You Need a Paid AI Tool?
Not necessarily.
For simple questions, you may already have enough capability through your existing Google Workspace tools or a general AI service.
A paid tool becomes more attractive when you need:
- Recurring reports
- Large datasets
- Multiple data sources
- Automated dashboards
- Team workflows
- Scheduled analysis
- Advanced transformations
Don’t pay for a dashboard platform just because it has an AI label.
Match the tool to the actual problem.
Privacy: Don’t Ignore This
Before sending spreadsheet data to an AI system, understand what happens to that data.
This matters especially when your spreadsheet contains:
- Customer information
- Employee records
- Financial information
- Internal company data
- Contracts
- Confidential business metrics
Google says Gemini for Workspace applies the organization’s existing controls, permissions and data-handling practices, and says Workspace content is not used to train generative AI models outside the organization without permission.
Third-party tools can have different architectures and policies.
So before connecting an external AI service:
Check its permissions, data retention, processing and privacy documentation.
A Simple AI Analysis Workflow Anyone Can Use
If you’re new to AI spreadsheet analysis, don’t overcomplicate it.
Use this:
Step 1 — Clean
Remove obvious duplicates and formatting problems.
Step 2 — Structure
Make sure every column has a clear header.
Step 3 — Ask
Start with one specific question.
Step 4 — Calculate
Ask AI to show important calculations.
Step 5 — Explore
Ask follow-up questions about trends and anomalies.
Step 6 — Visualize
Create a chart when it actually improves understanding.
Step 7 — Verify
Check important findings against the source data.
Step 8 — Decide
Only after verification should the analysis influence a business decision.
This workflow is much safer than asking AI to “analyze everything” and accepting whatever summary it produces.
10 Useful Google Sheets AI Prompts
You can adapt these to your own dataset.
1. Find trends
“Identify the three most important trends in this dataset and support each one with numbers.”
2. Find outliers
“Find values that appear unusually high or low compared with the rest of the dataset and explain why they stand out.”
3. Compare periods
“Compare this month’s performance with the previous month and show the largest changes.”
4. Find top performers
“Rank the products by revenue and show the percentage contribution of each.”
5. Customer analysis
“Identify the customer segment with the highest average order value.”
6. Marketing analysis
“Calculate cost per acquisition for each campaign and rank them from most to least efficient.”
7. Data quality
“Identify missing, inconsistent, duplicated or suspicious values that could affect this analysis.”
8. Executive summary
“Summarize the five most important findings from this dataset for a business manager who has one minute to read the answer.”
9. Follow-up investigation
“Which findings deserve further investigation, and what additional data would I need to confirm them?”
10. Challenge your conclusion
“Review your previous analysis and identify any conclusions that may be unsupported by the available data.”
That final prompt is particularly useful.
Don’t only ask AI to prove its first answer. Ask it to challenge it.
The Bottom Line On How to Analyze Google Sheets Data With AI
You don’t need to be a spreadsheet expert to start analyzing Google Sheets data with AI. If Gemini is available in your Sheets account, it’s the easiest starting point because it can analyze data, identify trends, answer questions and create charts directly within the spreadsheet.
For small datasets and one-off questions, copying a clean dataset into an AI chatbot can be enough. For repetitive in-sheet tasks, AI functions or add-ons can help. For large, recurring reporting workflows, dedicated AI analytics platforms may be a better fit.
But the most important part isn’t the tool.
It’s how you ask the question and how you verify the answer.
Use:
Clean data → Specific question → AI analysis → Evidence → Human verification → Decision
rather than:
Upload spreadsheet → Ask “What does this tell me?” → Trust the answer.
AI can make spreadsheet analysis dramatically faster. It does not remove the need for good data, clear questions or human judgment.
Read More: Google Sheets AI Data Cleaning
FAQ On How to Analyze Google Sheets Data With AI
Can I analyze Google Sheets data with AI for free?
Sometimes. Google Sheets has AI capabilities available through eligible Google Workspace or Google AI plans, while some external AI tools offer free tiers or limited usage. Availability and limits vary by product and plan.
Can Gemini analyze Google Sheets data?
Yes. Google’s current documentation says Gemini in Sheets can analyze data, identify trends and key findings, create charts, and answer questions about spreadsheet data.
Can ChatGPT analyze Google Sheets data?
Yes. You can provide spreadsheet data to a compatible ChatGPT workflow and ask it to calculate, summarize, compare and analyze the dataset. For small datasets, copying the relevant data into an AI conversation can be a simple approach.
What is the best AI tool for analyzing Google Sheets?
There is no universal best tool. Gemini is a logical starting point for Google Sheets users who have access to it. Dedicated analytics platforms make more sense when you need recurring reports, dashboards, large-scale analysis or multiple data sources.
Can AI find trends in Google Sheets?
Yes. Gemini in Sheets can identify trends, outliers and key findings from spreadsheet data.
Can AI create charts from Google Sheets data?
Yes. Gemini in Sheets can help create charts and graphs from spreadsheet data.
Can AI analyze thousands of rows?
Some AI tools can work with large datasets, but capabilities, limits and accuracy vary. Google documents specific limits for its AI function, so users should check the current feature limits rather than assuming unlimited processing.
Is AI analysis of Google Sheets accurate?
It can be useful, but it is not automatically correct. Check calculations, source ranges, missing values, duplicates and assumptions before using important findings for business decisions.
Should I upload sensitive spreadsheet data to AI?
Be careful. Review the AI service’s privacy, permissions, retention and data-processing policies first. For confidential information, use a service and account configuration that meets your organization’s requirements.
What should I ask AI to analyze in a spreadsheet?
Start with a specific question such as identifying trends, comparing periods, finding outliers, ranking products, calculating efficiency or summarizing customer feedback. Specific prompts generally produce more useful results than simply asking AI to “analyze everything.
Google Sheets users can use Gemini to identify trends, analyze spreadsheet data, and generate insights directly from their sheets. You can learn more about Google’s current Gemini features and supported analysis workflows in the official guide.
1 thought on “How to Analyze Google Sheets Data With AI: 5 Easy Methods (2026)”